Category: Cloud

  • Why More Companies Need an Internal AI Gateway Before AI Spend Gets Out of Control

    Why More Companies Need an Internal AI Gateway Before AI Spend Gets Out of Control

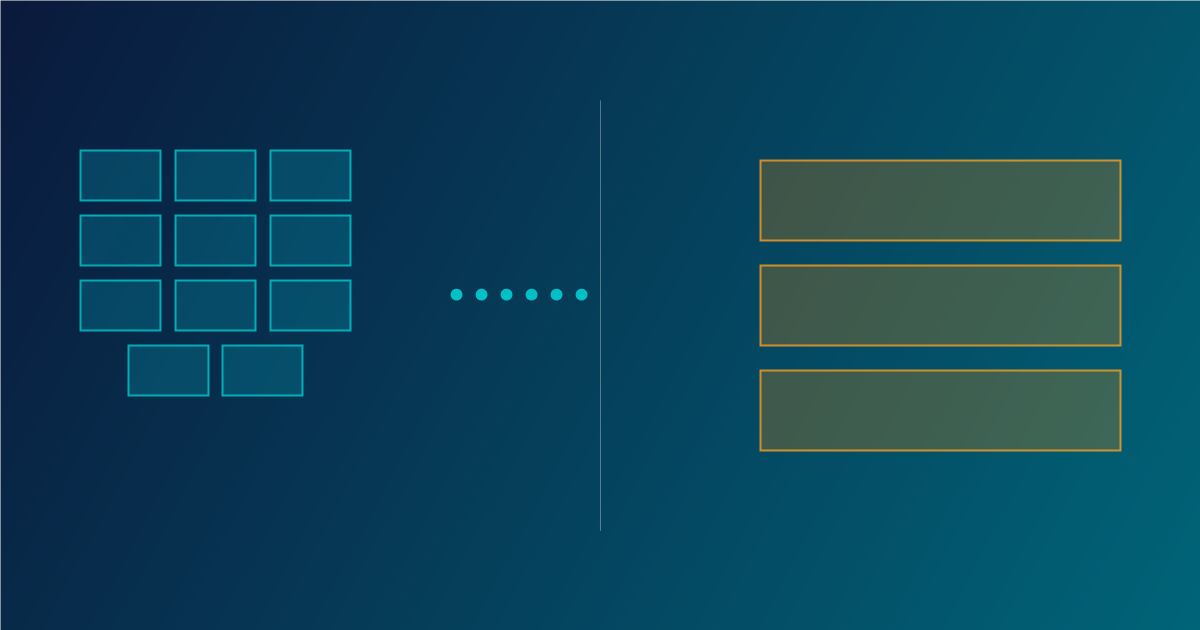
    Most companies do not have a model problem. They have a control problem. Teams adopt one model for chat, another for coding, a third for retrieval, and a fourth for document workflows, then discover that costs, logs, prompts, and policy enforcement are scattered everywhere. The result is avoidable sprawl. An internal AI gateway gives the business one place to route requests, apply policy, measure usage, and swap providers without forcing every product team to rebuild the same plumbing.

    The term sounds architectural, but the idea is practical. Instead of letting every application call every model provider directly, you place a controlled service in the middle. That service handles authentication, routing, logging, fallback logic, guardrails, and budget controls. Product teams still move quickly, but they do it through a path the platform, security, and finance teams can actually understand.

    Why direct-to-model integration breaks down at scale

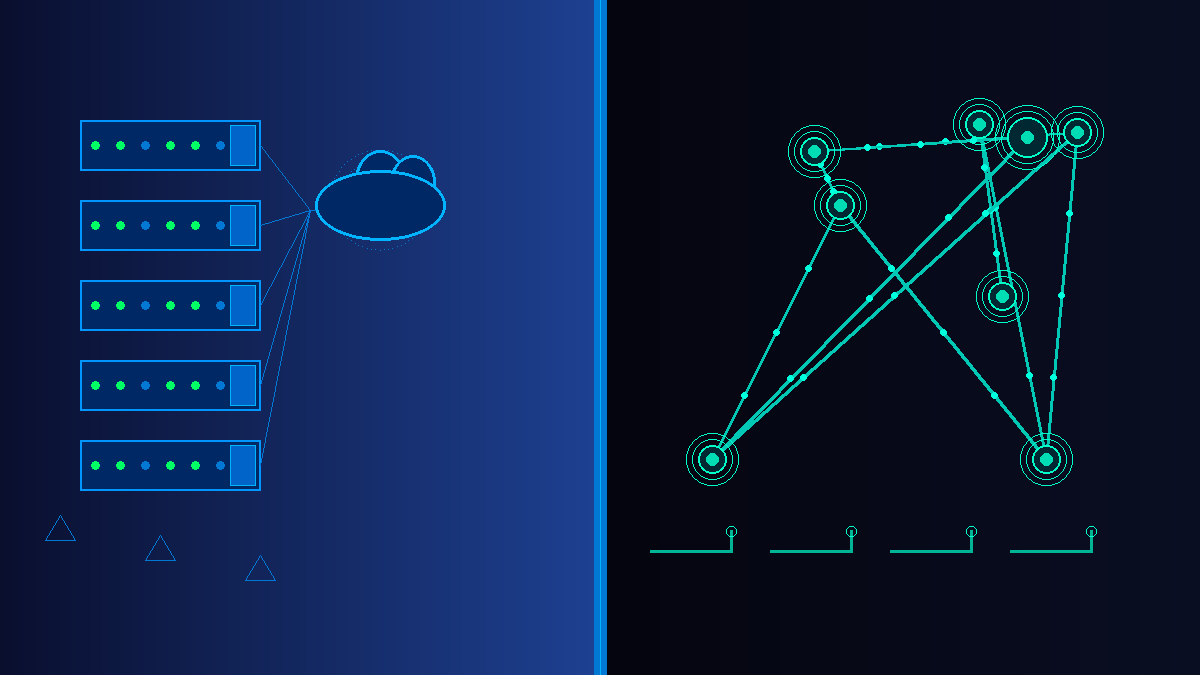
    Direct integrations feel fast in the first sprint. A developer can wire up a provider SDK, add a secret, and ship a useful feature. The trouble appears later. Different teams choose different providers, naming conventions, retry patterns, and logging formats. One app stores prompts for debugging, another stores nothing, and a third accidentally logs sensitive inputs where it should not. Costs rise faster than expected because there is no shared view of which workflows deserve premium models and which ones could use smaller, cheaper options.

    That fragmentation also makes governance reactive. Security teams end up auditing a growing collection of one-off integrations. Platform teams struggle to add caching, rate limits, or fallback behavior consistently. Leadership hears about AI productivity gains, but cannot answer simple operating questions such as which providers are in use, what business units spend the most, or which prompts touch regulated data.

    What an internal AI gateway should actually do

    A useful gateway is more than a reverse proxy with an API key. It becomes the shared control plane for model access. At minimum, it should normalize authentication, capture structured request and response metadata, enforce policy, and expose routing decisions in a way operators can inspect later. If the gateway cannot explain why a request went to a specific model, it is not mature enough for serious production use.

    • Model routing: choose providers and model tiers based on task type, latency targets, geography, or budget policy.
    • Observability: log token usage, latency, failure rates, prompt classifications, and business attribution tags.
    • Guardrails: apply content filters, redaction, schema validation, and approval rules before high-risk actions proceed.
    • Resilience: provide retries, fallbacks, and graceful degradation when a provider slows down or fails.
    • Cost control: enforce quotas, budget thresholds, caching, and model downgrades where quality impact is acceptable.

    Those capabilities matter because AI traffic is rarely uniform. A customer-facing assistant, an internal coding helper, and a nightly document classifier do not need the same models or the same policies. The gateway gives you a single place to encode those differences instead of scattering them across application teams.

    Design routing around business intent, not model hype

    One of the biggest mistakes in enterprise AI programs is buying into a single-model strategy for every workload. The best model for complex reasoning may not be the right choice for summarization, extraction, classification, or high-volume support automation. An internal gateway lets you route based on intent. You can send low-risk, repetitive work to efficient models while reserving premium reasoning models for tasks where the extra cost clearly changes the outcome.

    That routing layer also protects you from provider churn. Model quality changes, pricing changes, API limits change, and new options appear constantly. If every application is tightly coupled to one vendor, changing course becomes a portfolio-wide migration. If applications talk to your gateway instead, the platform team can adjust routing centrally and keep the product surface stable.

    Make observability useful to engineers and leadership

    Observability is often framed as an operations feature, but it is really the bridge between technical execution and business accountability. Engineers need traces, error classes, latency distributions, and prompt version histories. Leaders need to know which products generate value, which workflows burn budget, and where quality problems originate. A good gateway serves both audiences from the same telemetry foundation.

    That means adding context, not just raw token counts. Every request should carry metadata such as application name, feature name, environment, owner, and sensitivity tier. With that data, cost spikes stop being mysterious. You can identify whether a sudden increase came from a product launch, a retry storm, a prompt regression, or a misuse case that should have been throttled earlier.

    Treat policy enforcement as product design

    Policy controls fail when they arrive as a late compliance add-on. The best AI gateways build governance into the request lifecycle. Sensitive inputs can be redacted before they leave the company boundary. High-risk actions can require a human approval step. Certain workloads can be pinned to approved regions or approved model families. Output schemas can be validated before downstream systems act on them.

    This is where platform teams can reduce friction instead of adding it. If safe defaults, standard audit logs, and approval hooks are already built into the gateway, product teams do not have to reinvent them. Governance becomes the paved road, not the emergency brake.

    Control cost before finance asks hard questions

    AI costs usually become visible after adoption succeeds, which is exactly the wrong time to discover that no one can manage them. A gateway helps because it can enforce quotas by team, shift routine workloads to cheaper models, cache repeated requests, and alert owners when usage patterns drift. It also creates the data needed for showback or chargeback, which matters once multiple departments rely on shared AI infrastructure.

    Cost control should not mean blindly downgrading model quality. The better approach is to map workloads to value. If a premium model reduces human review time in a revenue-generating workflow, that may be a good trade. If the same model is summarizing internal status notes that no one reads, it probably is not. The gateway gives you the levers to make those tradeoffs deliberately.

    Start small, but build the control plane on purpose

    You do not need a massive platform program to get started. Many teams begin with a small internal service that standardizes model credentials, request metadata, and logging for one or two important workloads. From there, they add policy checks, routing logic, and dashboards as adoption grows. The key is to design for central control early, even if the first version is intentionally lightweight.

    AI adoption is speeding up, and model ecosystems will keep shifting underneath it. Companies that rely on direct, unmanaged integrations will spend more time untangling operational messes than delivering value. Companies that build an internal AI gateway create leverage. They gain model flexibility, clearer governance, better resilience, and a saner cost story, all without forcing every team to solve the same infrastructure problem alone.

  • Azure OpenAI Service vs. OpenAI API: How to Choose the Right Path for Enterprise Workloads

    Azure OpenAI Service vs. OpenAI API: How to Choose the Right Path for Enterprise Workloads

    When an engineering team decides to add a large language model to their product, one of the first architectural forks in the road is whether to route through Azure OpenAI Service or connect directly to the OpenAI API. Both surfaces expose many of the same models. Both let you call GPT-4o, embeddings endpoints, and the assistants API. But the governance story, cost structure, compliance posture, and operational experience are meaningfully different — and picking the wrong one for your context creates technical debt that compounds over time.

    This guide walks through the real decision criteria so you can make an informed call rather than defaulting to whichever option you set up fastest in a proof of concept.

    Why the Two Options Exist at All

    OpenAI publishes a public API that anyone with a billing account can use. Azure OpenAI Service is a licensed deployment of the same model weights running inside Microsoft’s cloud infrastructure. Microsoft and OpenAI have a deep partnership, but the two products are separate products with separate SKUs, separate support contracts, and separate compliance certifications.

    The existence of both is not an accident. Enterprise buyers often have Microsoft Enterprise Agreements, data residency requirements, or compliance mandates that make the Azure path necessary regardless of preference. Startups and smaller teams often have the opposite situation: they want the fastest path to production with no Azure dependency, and the OpenAI API gives them that.

    Data Privacy and Compliance: The Biggest Differentiator

    For many organizations, this section alone determines the answer. Azure OpenAI Service is covered by the Microsoft Azure compliance framework, which includes SOC 2, ISO 27001, HIPAA Business Associate Agreements, FedRAMP High (for government deployments), and regional data residency options across Azure regions. Customer data processed through Azure OpenAI is not used to train Microsoft or OpenAI models by default, and Microsoft’s data processing agreements with enterprise customers give legal teams something concrete to review.

    The public OpenAI API has its own privacy commitments and an enterprise tier with stronger data handling terms. For companies that are already all-in on Microsoft’s compliance umbrella, however, Azure OpenAI fits more naturally into existing audit evidence and vendor management processes. If your legal team already trusts Azure for sensitive workloads, adding an OpenAI API dependency creates a second vendor to review, a second DPA to negotiate, and a second line item in your annual vendor risk assessment.

    If your workload involves healthcare data, government information, or anything subject to strict data localization requirements, Azure OpenAI Service is usually the faster path to a compliant architecture.

    Model Availability and the Freshness Gap

    This is where the OpenAI API often has a visible advantage: new models typically appear on the public API first, and Azure OpenAI gets them on a rolling deployment schedule that can lag by weeks or months depending on the model and region. If you need access to the absolute latest model version the day it launches, the OpenAI API is the faster path.

    For most production workloads, this freshness gap matters less than it seems. If your application is built against GPT-4o and that model is stable, a few weeks between OpenAI API availability and Azure OpenAI availability is rarely a blocker. Where it does matter is in research contexts, competitive intelligence use cases, or when a specific new capability (like an expanded context window or a new modality) is central to your product roadmap.

    Azure OpenAI also requires you to provision deployments in specific regions and with specific capacity quotas, which can create lead time before you can actually call a new model at scale. The public OpenAI API shares capacity across a global pool and does not require pre-provisioning in the same way, which makes it more immediately flexible during prototyping and early scaling stages.

    Networking, Virtual Networks, and Private Connectivity

    If your application runs inside an Azure Virtual Network and you need your AI traffic to stay on the Microsoft backbone without leaving the Azure network boundary, Azure OpenAI Service supports private endpoints and VNet integration directly. You can lock down your Azure OpenAI resource so it is only accessible from within your VNet, which is a meaningful control for organizations with strict network egress policies.

    The public OpenAI API is accessed over the public internet. You can add egress filtering, proxy layers, and API gateways on top of it, but you cannot natively terminate the connection inside a private network the way Azure Private Link enables for Azure services. For teams running zero-trust architectures or airgapped segments, this difference is not trivial.

    Pricing: Similar Models, Different Billing Mechanics

    Token pricing for equivalent models is generally comparable between the two platforms, but the billing mechanics differ in ways that affect cost predictability. Azure OpenAI offers Provisioned Throughput Units (PTUs), which let you reserve dedicated model capacity in exchange for a predictable hourly rate. This makes sense for workloads with consistent, high-volume traffic because you avoid the variable cost exposure of pay-per-token pricing at scale.

    The public OpenAI API does not have a direct PTU equivalent, though OpenAI has introduced reserved capacity options for enterprise customers. For most standard deployments, you pay per token consumed with standard rate limits. Both platforms offer usage-based pricing that scales with consumption, but Azure PTUs give finance teams a more predictable line item when the workload is stable and well-understood.

    If you are already running Azure workloads and have committed spend through a Microsoft Azure consumption agreement, Azure OpenAI costs can often count toward those commitments, which may matter for your purchasing structure.

    Content Filtering and Policy Controls

    Both platforms include content filtering by default, but Azure OpenAI gives enterprise customers more configuration flexibility over filtering layers, including the ability to request custom content policy configurations for specific approved use cases. This matters for industries like law, medicine, or security research, where the default content filters may be too restrictive for legitimate professional applications.

    These configurations require working directly with Microsoft and going through a review process, which adds friction. But the ability to have a supported, documented policy exception is often preferable to building custom filtering layers on top of a more restrictive default configuration.

    Integration with Azure Services

    If your AI application is part of a broader Azure-native stack, Azure OpenAI Service integrates naturally with the surrounding ecosystem. Azure AI Search (formerly Cognitive Search) connects directly for retrieval-augmented generation pipelines. Azure Managed Identity handles authentication without embedding API keys in application configuration. Azure Monitor and Application Insights collect telemetry alongside your other Azure workloads. Azure API Management can sit in front of your Azure OpenAI deployment for rate limiting, logging, and policy enforcement.

    The public OpenAI API works with all of these things too, but you are wiring them together manually rather than using native integrations. For teams who have already invested in Azure’s operational tooling, the Azure OpenAI path produces less integration code and fewer moving parts to maintain.

    When the OpenAI API Is the Right Call

    There are real scenarios where connecting directly to the OpenAI API is the better choice. If your company has no significant Azure footprint and no compliance requirements that push you toward Microsoft’s certification umbrella, adding Azure just to access OpenAI models adds operational overhead with no payoff. You now have another cloud account to manage, another identity layer to maintain, and another billing relationship to track.

    Startups moving fast in early-stage product development often benefit from the OpenAI API’s simplicity. You create an account, get an API key, and start building. The latency to first working prototype is lower when you are not provisioning Azure resources, configuring resource groups, or waiting for quota approvals in specific regions.

    The OpenAI API also gives you access to features and endpoints that sometimes appear in OpenAI’s product before they are available through Azure. If your competitive advantage depends on using the latest model capabilities as soon as they ship, the direct API path keeps that option open.

    Making the Decision: A Practical Framework

    Rather than defaulting to one or the other, run through these questions before committing to an architecture:

    • Does your workload handle regulated data? If yes and you are already in Azure, Azure OpenAI is almost always the right answer.
    • Do you have an existing Azure footprint? If you already manage Azure resources, Azure OpenAI fits naturally into your operational model with minimal additional overhead.
    • Do you need private network access to the model endpoint? Azure OpenAI supports Private Link. The public OpenAI API does not.
    • Do you need the absolute latest model the day it launches? The public OpenAI API tends to get new models first.
    • Is cost predictability important at scale? Azure Provisioned Throughput Units give you a stable hourly cost model for high-volume workloads.
    • Are you building a fast prototype with no Azure dependencies? The public OpenAI API gets you started with less setup friction.

    For most enterprise teams with existing Azure commitments, Azure OpenAI Service is the more defensible choice. It fits into existing compliance frameworks, supports private networking, integrates with managed identity and Azure Monitor, and gives procurement teams a single vendor relationship. The tradeoff is some lag on new model availability and more initial setup compared to grabbing an API key and calling it directly.

    For independent developers, startups without Azure infrastructure, or teams that need the newest model capabilities immediately, the OpenAI API remains the faster and more flexible path.

    Neither answer is permanent. Many organizations start with the public OpenAI API for rapid prototyping and migrate to Azure OpenAI Service once the use case is validated, compliance review is initiated, and production-scale infrastructure planning begins. What matters is that you make the switch deliberately, with your architectural requirements driving the decision — not convenience at the moment you set up your first proof of concept.

  • Azure Policy as Code: How to Govern Cloud Resources at Scale Without Losing Your Mind

    Azure Policy as Code: How to Govern Cloud Resources at Scale Without Losing Your Mind

    If you’ve spent any time managing a non-trivial Azure environment, you’ve probably hit the same wall: things drift. Someone creates a storage account without encryption at rest. A subscription gets spun up without a cost center tag. A VM lands in a region you’re not supposed to use. Manual reviews catch some of it, but not all of it — and by the time you catch it, the problem has already been live for weeks.

    Azure Policy offers a solution, but clicking through the Azure portal to define and assign policies one at a time doesn’t scale. The moment you have more than a handful of subscriptions or a team larger than one person, you need something more disciplined. That’s where Policy as Code (PaC) comes in.

    This guide walks through what Policy as Code means for Azure, how to structure a working repository, the key operational decisions you’ll need to make, and how to wire it all into a CI/CD pipeline so governance is automatic — not an afterthought.


    What “Policy as Code” Actually Means

    The phrase sounds abstract, but the idea is simple: instead of managing your Azure Policies through the portal, you store them in a Git repository as JSON or Bicep files, version-control them like any other infrastructure code, and deploy them through an automated pipeline.

    This matters for several reasons.

    First, Git history becomes your audit trail. Every policy change, every exemption, every assignment — it’s all tracked with who changed it, when, and why (assuming your team writes decent commit messages). That’s something the portal can never give you.

    Second, you can enforce peer review. If someone wants to create a new “allowed locations” policy or relax an existing deny effect, they open a pull request. Your team reviews it before it goes anywhere near production.

    Third, you get consistency across environments. A staging environment governed by a slightly different set of policies than production is a gap waiting to become an incident. Policy as Code makes it easy to parameterize for environment differences without maintaining completely separate policy definitions.

    Structuring Your Policy Repository

    There’s no single right structure, but a layout that has worked well across a variety of team sizes looks something like this:

    azure-policy/
      policies/
        definitions/
          storage-require-https.json
          require-resource-tags.json
          allowed-vm-skus.json
        initiatives/
          security-baseline.json
          tagging-standards.json
      assignments/
        subscription-prod.json
        subscription-dev.json
        management-group-root.json
      exemptions/
        storage-legacy-project-x.json
      scripts/
        deploy.ps1
        test.ps1
      .github/
        workflows/
          policy-deploy.yml

    Policy definitions live in policies/definitions/ — these are the raw policy rule files. Initiatives (policy sets) group related definitions together in policies/initiatives/. Assignments connect initiatives or individual policies to scopes (subscriptions, management groups, resource groups) and live in assignments/. Exemptions are tracked separately so they’re visible and reviewable rather than buried in portal configuration.

    Writing a Solid Policy Definition

    A policy definition file is JSON with a few key sections: displayName, description, mode, parameters, and policyRule. Here’s a practical example — requiring that all storage accounts enforce HTTPS-only traffic:

    {
      "displayName": "Storage accounts should require HTTPS-only traffic",
      "description": "Ensures that all Azure Storage accounts are configured with supportsHttpsTrafficOnly set to true.",
      "mode": "Indexed",
      "parameters": {
        "effect": {
          "type": "String",
          "defaultValue": "Audit",
          "allowedValues": ["Audit", "Deny", "Disabled"]
        }
      },
      "policyRule": {
        "if": {
          "allOf": [
            {
              "field": "type",
              "equals": "Microsoft.Storage/storageAccounts"
            },
            {
              "field": "Microsoft.Storage/storageAccounts/supportsHttpsTrafficOnly",
              "notEquals": true
            }
          ]
        },
        "then": {
          "effect": "[parameters('effect')]"
        }
      }
    }

    A few design choices worth noting. The effect is parameterized — this lets you assign the same definition with Audit in dev (to surface violations without blocking) and Deny in production (to actively block non-compliant resources). Hardcoding the effect is a common early mistake that forces you to maintain duplicate definitions for different environments.

    The mode of Indexed means this policy only evaluates resource types that support tags and location. For policies targeting resource group properties or subscription-level resources, use All instead.

    Grouping Policies into Initiatives

    Individual policy definitions are powerful, but assigning them one at a time to every subscription is tedious and error-prone. Initiatives (also called policy sets) let you bundle related policies and assign the whole bundle at once.

    A tagging standards initiative might group together policies for requiring a cost-center tag, requiring an owner tag, and inheriting tags from the resource group. An initiative like this assigns cleanly at the management group level, propagates down to all subscriptions, and can be updated in one place when your tagging requirements change.

    Define your initiatives in a JSON file and reference the policy definitions by their IDs. When you deploy via the pipeline, definitions go up first, then initiatives get built from them, then assignments connect initiatives to scopes — order matters.

    Testing Policies Before They Touch Production

    There are two kinds of pain with policy governance: violations you catch before deployment, and violations you discover after. Policy as Code should maximize the first kind.

    Linting and schema validation can run in your CI pipeline on every pull request. Tools like the Azure Policy VS Code extension or Bicep’s built-in linter catch structural errors before they ever reach Azure.

    What-if analysis is available for some deployment scenarios. More practically, deploy to a dedicated governance test subscription first. Assign your policy with Audit effect, then run your compliance scripts and check the compliance report. If expected-compliant resources show as non-compliant, your policy logic has a bug.

    Exemptions are another testing tool — if a specific resource legitimately needs to be excluded from a policy (legacy system, approved exception, temporary dev environment), track that exemption in your repo with a documented justification and expiry date. Exemptions that live only in the portal are invisible and tend to become permanent by accident.

    Wiring Policy Deployment into CI/CD

    A minimal GitHub Actions workflow for policy deployment looks something like this:

    name: Deploy Azure Policies
    
    on:
      push:
        branches: [main]
        paths:
          - 'policies/**'
          - 'assignments/**'
          - 'exemptions/**'
      pull_request:
        branches: [main]
    
    jobs:
      validate:
        runs-on: ubuntu-latest
        steps:
          - uses: actions/checkout@v4
          - name: Validate policy JSON
            run: |
              find policies/ -name '*.json' | xargs -I {} python3 -c "import json,sys; json.load(open('{}'))" && echo "All JSON valid"
    
      deploy:
        runs-on: ubuntu-latest
        needs: validate
        if: github.ref == 'refs/heads/main'
        steps:
          - uses: actions/checkout@v4
          - uses: azure/login@v2
            with:
              creds: ${{ secrets.AZURE_CREDENTIALS }}
          - name: Deploy policy definitions
            run: ./scripts/deploy.ps1 -Stage definitions
          - name: Deploy initiatives
            run: ./scripts/deploy.ps1 -Stage initiatives
          - name: Deploy assignments
            run: ./scripts/deploy.ps1 -Stage assignments

    The key pattern: pull requests trigger validation only. Merges to main trigger the actual deployment. Policy changes that bypass review by going directly to main can be prevented with branch protection rules.

    For Azure DevOps shops, the same pattern applies using pipeline YAML with environment gates — require a manual approval before the assignment stage runs in production if your organization needs that extra checkpoint.

    Common Pitfalls Worth Avoiding

    Starting with Deny effects. The first instinct when you see a compliance gap is to block it immediately. Resist this. Start every new policy with Audit for at least two weeks. Let the compliance data show you what’s actually out of compliance before you start blocking things. Blocking before you understand the landscape leads to surprised developers and emergency exemptions.

    Scope creep in initiatives. It’s tempting to build one giant “everything” initiative. Don’t. Break initiatives into logical domains — security baseline, tagging standards, allowed regions, allowed SKUs. Smaller initiatives are easier to update, easier to understand, and easier to exempt selectively when needed.

    Not versioning your initiatives. When you change an initiative — adding a new policy, changing parameters — update the initiative’s display name and maintain a changelog. Initiatives that silently change are hard to reason about in compliance reports.

    Forgetting inherited policies. If you’re working in a larger organization where your management group already has policies assigned from above, those assignments interact with yours. Map the existing policy landscape before you assign new policies, especially deny-effect ones, to avoid conflicts or redundant coverage.

    Not cleaning up exemptions. Exemptions with no expiry date live forever. Add an expiry review process — even a simple monthly script that lists exemptions older than 90 days — and review whether they’re still justified.

    Getting Started Without Boiling the Ocean

    If you’re starting from scratch, a practical week-one scope is:

    1. Pick three policies you know you need: require encryption at rest on storage accounts, require tags on resource groups, deny resources in non-approved regions.
    2. Stand up a policy repo with the folder structure above.
    3. Deploy with Audit effect to a dev subscription.
    4. Fix the real violations you find rather than exempting them.
    5. Set up the CI/CD pipeline so future changes require a pull request.

    That scope is small enough to finish and large enough to prove the value. From there, building out a full security baseline initiative and expanding to production becomes a natural next step rather than a daunting project.

    Policy as Code isn’t glamorous, but it’s the difference between a cloud environment that drifts toward chaos and one that stays governable as it grows. The portal will always let you click things in. The question is whether anyone will know what got clicked, why, or whether it’s still correct six months later. Code and version control answer all three.

  • Terraform vs. Bicep vs. Pulumi: How to Choose the Right IaC Tool for Your Azure and Cloud Infrastructure

    Terraform vs. Bicep vs. Pulumi: How to Choose the Right IaC Tool for Your Azure and Cloud Infrastructure

    Why Infrastructure as Code Tool Choice Still Matters in 2026

    Infrastructure as code has been mainstream for years, yet engineering teams still debate which tool to use when they start a new project or migrate an existing environment. Terraform, Bicep, and Pulumi represent three distinct philosophies about how infrastructure should be described, managed, and maintained. Each has earned its place in the ecosystem — and each comes with trade-offs that can make or break a team’s productivity depending on context.

    This guide breaks down the real-world differences between Terraform, Bicep, and Pulumi so you can choose the right tool for your team’s skills, cloud footprint, and long-term operations requirements — rather than defaulting to whatever someone on the team used at their last job.

    Terraform: The Multi-Cloud Standard

    HashiCorp Terraform has been the dominant open-source IaC tool for most of the past decade. It uses a declarative configuration language called HCL (HashiCorp Configuration Language) that reads cleanly and is approachable for practitioners who are not software engineers. Terraform’s provider ecosystem is enormous — covering AWS, Azure, Google Cloud, Kubernetes, GitHub, Cloudflare, Datadog, and hundreds of other platforms in a consistent interface.

    Terraform’s state file model is one of its most consequential design choices. All deployed resources are tracked in a state file that Terraform uses to calculate diffs and plan changes. This makes drift detection and incremental updates precise, but it also means your team needs a reliable remote state backend — usually Azure Blob Storage, AWS S3, or Terraform Cloud — and must handle state locking carefully in team environments. State corruption, while uncommon, is a real operational concern.

    The licensing change HashiCorp made in 2023 — moving Terraform from the Mozilla Public License to the Business Source License (BSL) — prompted the community to fork the project as OpenTofu under the Linux Foundation. By 2026, most enterprises using Terraform have evaluated whether to migrate to OpenTofu or accept the BSL terms. For most teams using Terraform without commercial redistribution, the practical impact is limited, but the shift has added a layer of strategic consideration that was not present before.

    When Terraform Is the Right Choice

    Terraform excels when your organization manages infrastructure across multiple cloud providers and wants a single tool and workflow. Its declarative approach, mature module ecosystem, and broad community support make it the default choice for teams that are not already deeply invested in a specific cloud vendor’s native tooling. If your platform engineers have Terraform experience and your infrastructure spans more than one provider, Terraform (or OpenTofu) is a natural fit.

    Bicep: Azure-Native and Designed for Simplicity

    Bicep is Microsoft’s domain-specific language for deploying Azure resources. It is a declarative language that compiles down to ARM (Azure Resource Manager) JSON templates, which means anything expressible in ARM can be expressed in Bicep — just with dramatically less verbose syntax. Bicep integrates tightly with the Azure CLI, Azure DevOps, and GitHub Actions, and it ships first-class support in Visual Studio Code with real-time type checking, autocomplete, and inline documentation.

    One of Bicep’s most underappreciated advantages is that it has no external state file. Azure Resource Manager itself is the state store — Azure tracks what was deployed and what it should look like, so there is no separate file to manage or corruption to recover from. For teams that operate exclusively in Azure and want the lowest possible infrastructure overhead, this is a meaningful operational simplification.

    Bicep is also the tool Microsoft recommends for Azure Policy assignments, deployment stacks, and subscription-level deployments. If your team is already using Azure DevOps and managing Azure subscriptions as the primary cloud environment, Bicep’s deep integration with the Azure toolchain reduces the number of moving parts in your CI/CD pipeline.

    When Bicep Is the Right Choice

    Bicep is the clear winner when your organization is Azure-only or Azure-primary and your team wants the closest possible alignment with Microsoft’s supported tooling and roadmap. It requires no third-party toolchain to manage, no state backend to configure, and no provider versions to pin. For organizations subject to strict software supply chain requirements or those that prefer to minimize external open-source dependencies in production tooling, Bicep’s native Microsoft support is a genuine advantage.

    Pulumi: Infrastructure as Real Code

    Pulumi takes a different approach from both Terraform and Bicep: it lets you define infrastructure using general-purpose programming languages — TypeScript, Python, Go, C#, Java, and YAML. Rather than learning a configuration language, engineers write infrastructure definitions using the same language patterns, testing frameworks, and IDE tooling they use for application code. This makes Pulumi particularly compelling for platform engineering teams with strong software development backgrounds who want to apply standard software engineering practices — unit tests, code reuse, abstraction patterns — to infrastructure code.

    Pulumi uses its own state management system, which can be hosted in Pulumi Cloud (the managed SaaS offering) or self-hosted in a cloud storage bucket. Like Terraform, Pulumi tracks resource state explicitly, which enables precise drift detection and update planning. The Pulumi Automation API is a standout feature: it allows teams to embed infrastructure deployments directly into their own applications and scripts without shelling out to the Pulumi CLI, enabling sophisticated orchestration scenarios that are difficult to achieve with declarative-only tools.

    The trade-off with Pulumi is that the expressiveness of a general-purpose language cuts both ways. Teams with disciplined engineering practices will find Pulumi enables clean, testable, maintainable infrastructure code. Teams with less structure may produce infrastructure that is harder to read and audit than equivalent Terraform HCL — especially for operators who are not comfortable with the chosen language. Code review complexity scales with language complexity.

    When Pulumi Is the Right Choice

    Pulumi shines for platform engineering teams building internal developer platforms, composable infrastructure abstractions, or complex multi-cloud environments where the expressiveness of a real programming language delivers a genuine productivity advantage. It is also a natural fit when the same team is responsible for both application and infrastructure code and wants to apply consistent engineering practices across both. If your team is already writing TypeScript or Python and wants infrastructure that lives alongside application code with the same testing and review workflows, Pulumi is worth serious evaluation.

    Side-by-Side: Key Differences That Should Influence Your Decision

    Understanding the practical distinctions across a few key dimensions makes the trade-offs clearer:

    • Cloud scope: Terraform and Pulumi support multiple cloud providers; Bicep is Azure-only.
    • State management: Bicep uses Azure as the implicit state store. Terraform and Pulumi require explicit state backend configuration.
    • Language: Terraform uses HCL; Bicep uses a purpose-built DSL; Pulumi uses TypeScript, Python, Go, C#, or Java.
    • Testing: Pulumi offers the richest native testing story using standard language test frameworks. Terraform supports unit and integration testing via the testing framework added in 1.6. Bicep testing relies primarily on Azure deployment validation and Pester-based test scripts.
    • Community and ecosystem: Terraform has the largest existing module ecosystem. Pulumi has growing component libraries. Bicep relies on Azure-maintained modules and the Bicep registry.
    • Licensing: Bicep is MIT-licensed. Pulumi is Apache 2.0. Terraform is BSL post-1.5; OpenTofu is MPL 2.0.

    Migration and Adoption Considerations

    Switching IaC tools mid-project carries real risk and cost. Before committing to a tool, consider how your existing infrastructure was provisioned, what your team already knows, and what your CI/CD pipeline currently supports.

    Terraform can import existing Azure resources with terraform import or the newer import block syntax introduced in Terraform 1.5. Bicep supports ARM template decompilation to bootstrap Bicep files from existing deployments. Pulumi offers import commands and a pulumi convert utility that can translate Terraform HCL into Pulumi programs in supported languages, which meaningfully reduces the migration cost for teams moving from Terraform.

    For greenfield projects, the choice is mostly about team skills and strategic direction. For existing environments, assess the cost of migrating state, rewriting definitions, and retraining the team against the benefits of the target tool before committing.

    The Honest Recommendation

    There is no universally correct answer here — which is exactly why this debate persists in engineering teams across the industry. The decision should be driven by three questions: What cloud providers do you need to manage? What skills does your team already have? And what level of infrastructure-as-software sophistication does your use case actually require?

    If you manage multiple clouds and want a proven, widely-understood tool with a massive community, use Terraform or OpenTofu. If you are Azure-focused and want Microsoft-supported simplicity with zero external state management, use Bicep. If your team is software-engineering-first and wants to apply proper software development practices to infrastructure — unit tests, abstraction, automation APIs — give Pulumi a serious look.

    All three tools are production-ready, actively maintained, and used successfully by engineering teams at scale. The right choice is the one your team will actually use well.

  • FinOps for AI: How to Control LLM Inference Costs at Scale

    FinOps for AI: How to Control LLM Inference Costs at Scale

    As AI adoption accelerates across enterprise teams, so does one uncomfortable reality: running large language models at scale is expensive. Token costs add up quickly, inference latency affects user experience, and cloud bills for AI workloads can balloon without warning. FinOps — the practice of applying financial accountability to cloud operations — is now just as important for AI workloads as it is for virtual machines and object storage.

    This post breaks down the key cost drivers in LLM inference, the optimization strategies that actually work, and how to build measurement and governance practices that keep AI costs predictable as your usage grows.

    Understanding What Drives LLM Inference Costs

    Before you can control costs, you need to understand where they come from. LLM inference billing typically has a few major components, and knowing which levers to pull makes all the difference.

    Token Consumption

    Most hosted LLM providers — OpenAI, Anthropic, Azure OpenAI, Google Vertex AI — charge per token, typically split between input tokens (your prompt plus context) and output tokens (the model’s response). Output tokens are generally more expensive than input tokens because generating them requires more compute. A 4,000-token input with a 500-token output costs very differently than a 500-token input with a 4,000-token output, even though the total token count is the same.

    Prompt engineering discipline matters here. Verbose system prompts, large context windows, and repeated retrieval of the same documents all inflate input token counts silently over time. Every token sent to the API costs money.

    Model Selection

    The gap in cost between frontier models and smaller models can be an order of magnitude or more. GPT-4-class models may cost 20 to 50 times more per token than smaller, faster models in the same provider’s lineup. Many production workloads don’t need the strongest model available — they need a model that’s good enough for a defined task at a price that scales.

    A classification task, a summarization pipeline, or a customer-facing FAQ bot rarely needs a frontier model. Reserving expensive models for tasks that genuinely require them — complex reasoning, nuanced generation, multi-step agent workflows — is one of the highest-leverage cost decisions you can make.

    Request Volume and Provisioned Capacity

    Some providers and deployment models charge based on provisioned throughput or reserved capacity rather than pure per-token consumption. Azure OpenAI’s Provisioned Throughput Units (PTUs), for example, charge for reserved model capacity regardless of whether you use it. This can be significantly cheaper at high, steady traffic loads, but expensive if utilization is uneven or unpredictable. Understanding your traffic patterns before committing to reserved capacity is essential.

    Optimization Strategies That Move the Needle

    Cost optimization for AI workloads is not a one-time audit — it is an ongoing engineering discipline. Here are the strategies with the most practical impact.

    Prompt Compression and Optimization

    Systematically auditing and trimming your prompts is one of the fastest wins. Remove redundant instructions, consolidate examples, and replace verbose explanations with tighter phrasing. Tools like LLMLingua and similar prompt compression libraries can reduce token counts by three to five times on complex prompts with minimal quality loss. If your system prompt is 2,000 tokens, shaving it to 600 tokens across thousands of daily requests adds up to significant monthly savings.

    Context window management is equally important. Retrieval-augmented generation (RAG) architectures that naively inject large document chunks into every request waste tokens on irrelevant context. Tuning chunk size, relevance thresholds, and the number of retrieved documents to the minimum needed for quality results keeps context lean.

    Response Caching

    Many LLM requests are repeated or nearly identical. Customer support workflows, knowledge base lookups, and template-based generation pipelines often ask similar questions with similar prompts. Semantic caching — storing the embeddings and responses for previous requests, then returning cached results when a new request is semantically close enough — can cut inference costs by 30 to 60 percent in the right workloads.

    Several inference gateway platforms including LiteLLM, Portkey, and Azure API Management with caching policies support semantic caching out of the box. Even a simple exact-match cache for identical prompts can eliminate a surprising amount of redundant API calls in high-volume workflows.

    Model Routing and Tiering

    Intelligent request routing sends easy requests to cheaper, faster models and reserves expensive models for requests that genuinely need them. This is sometimes called a cascade or routing pattern: a lightweight classifier evaluates each incoming request and decides which model tier to use based on complexity signals like query length, task type, or confidence threshold.

    In practice, you might route 70 percent of requests to a small, fast model that handles them adequately, and escalate the remaining 30 percent to a larger model only when needed. If your cheaper model costs a tenth of your premium model, this pattern could reduce inference costs by 60 to 70 percent with acceptable quality tradeoffs.

    Batching and Async Processing

    Not every LLM request needs a real-time response. For workflows like document processing, content generation pipelines, or nightly summarization jobs, batching requests allows you to use asynchronous batch inference APIs that many providers offer at significant discounts. OpenAI’s Batch API processes requests at 50 percent of the standard per-token price in exchange for up to 24-hour turnaround. For high-volume, non-interactive workloads, this represents a straightforward cost reduction that goes unused at many organizations.

    Fine-Tuning and Smaller Specialized Models

    When a workload is well-defined and high-volume — product description generation, structured data extraction, sentiment classification — fine-tuning a smaller model on domain-specific examples can produce better results than a general-purpose frontier model at a fraction of the inference cost. The upfront fine-tuning expense amortizes quickly when it enables you to run a smaller model instead of a much larger one.

    Self-hosted or private cloud deployment adds another lever: for sufficiently high request volumes, running open-weight models on dedicated GPU infrastructure can be cheaper than per-token API pricing. This requires more operational maturity, but the economics become compelling above certain request thresholds.

    Measuring and Governing AI Spend

    Optimization strategies only work if you have visibility. Without measurement, you are guessing. Good FinOps for AI requires the same instrumentation discipline you would apply to any cloud service.

    Token-Level Telemetry

    Log token counts — input, output, and total — for every inference request alongside your application telemetry. Tag logs with the relevant feature, team, or product area so you can attribute costs to the right owners. Most provider SDKs return token usage in every API response; capturing this and writing it to your observability platform costs almost nothing and gives you the data you need for both alerting and chargeback.

    Set per-feature and per-team cost budgets with alerts. If your document summarization pipeline suddenly starts consuming five times more tokens per request, you want an alert before the monthly bill arrives rather than after.

    Chargeback and Cost Attribution

    In multi-team organizations, centralizing AI spend under a single cost center without attribution creates bad incentives. Teams that do not see the cost of their AI usage have no reason to optimize it. Implementing a chargeback or showback model — even an informal one that shows each team their monthly AI spend in a dashboard — shifts the incentive structure and drives organic optimization.

    Azure Cost Management, AWS Cost Explorer, and third-party FinOps platforms like Apptio or Vantage can help aggregate cloud AI spend. Pairing cloud-level billing data with your own token-level telemetry gives you both macro visibility and the granular detail to diagnose spikes.

    Guardrails and Spend Limits

    Do not rely solely on after-the-fact alerting. Enforce hard spending limits and rate limits at the API level. Most providers support per-key spending caps, quota limits, and rate limiting. An AI inference gateway can add a policy layer in front of your model calls that enforces per-user, per-feature, or per-team quotas before they reach the provider.

    Input validation and output length constraints are another form of guardrail. If your application does not need responses longer than 500 tokens, setting a max_tokens limit prevents runaway generation costs from prompts that elicit unexpectedly long outputs.

    Building a FinOps Culture for AI

    Technical optimizations alone are not enough. Sustainable cost management for AI requires organizational practices: regular cost reviews, clear ownership of AI spend, and cross-functional collaboration between the teams building AI features and the teams managing infrastructure budgets.

    A few practices that work well in practice:

    • Weekly or bi-weekly AI spend reviews as part of engineering standups or ops reviews, especially during rapid feature development.
    • Cost-per-output tracking for each AI-powered feature — not just raw token counts, but cost per summarization, cost per generated document, cost per resolved support ticket. This connects spend to business value and makes tradeoffs visible.
    • Model evaluation pipelines that include cost as a first-class metric alongside quality. When comparing two models for a task, the evaluation should include projected cost at production volume, not just benchmark accuracy.
    • Runbook documentation for cost spike response: who gets alerted, what the first diagnostic steps are, and what levers are available to reduce spend quickly if needed.

    The Bottom Line

    LLM inference costs are not fixed. They are a function of how thoughtfully you design your prompts, choose your models, cache your results, and measure your usage. Teams that treat AI infrastructure like any other cloud spend — with accountability, measurement, and continuous optimization — will get far more value from their AI investments than teams that treat model API bills as an unavoidable tax on innovation.

    The good news is that most of the highest-impact optimizations are not exotic. Trimming prompts, routing requests to appropriately-sized models, and caching repeated results are engineering basics. Apply them to your AI workloads the same way you would apply them anywhere else, and you will find more cost headroom than you expected.

  • Kubernetes vs. Azure Container Apps: How to Choose the Right Container Platform for Your Team

    Kubernetes vs. Azure Container Apps: How to Choose the Right Container Platform for Your Team

    Containerization changed how teams build and ship software. But choosing how to run those containers is a decision that has major downstream effects on your team's operational overhead, cost structure, and architectural flexibility. Two options that come up most often in Azure environments are Azure Kubernetes Service (AKS) and Azure Container Apps (ACA). They both run containers. They both scale. And they both sit in Azure. So what actually separates them — and when does each one win?

    This post breaks down the key differences so you can make a clear, informed choice rather than defaulting to “just use Kubernetes” because it's familiar.

    What Each Platform Actually Is

    Azure Kubernetes Service (AKS) is Microsoft's managed Kubernetes offering. You still manage node pools, configure networking, handle storage classes, set up ingress controllers, and reason about cluster capacity. Azure handles the Kubernetes control plane, but everything from the node level down is on you. AKS gives you the full Kubernetes API — every knob, every operator, every custom resource definition.

    Azure Container Apps (ACA) is a fully managed, serverless container platform. Under the hood it runs on Kubernetes and KEDA (the Kubernetes-based event-driven autoscaler), but that entire layer is completely hidden from you. You deploy containers. You define scale rules. Azure takes care of everything else, including zero-scale when traffic drops to nothing.

    The simplest mental model: AKS is infrastructure you control; ACA is a platform that controls itself.

    Operational Complexity: The Real Cost of Kubernetes

    Kubernetes is powerful, but it does not manage itself. On AKS, someone on your team needs to own the cluster. That means patching node pools when new Kubernetes versions drop, right-sizing VM SKUs, configuring cluster autoscaler settings, setting up an ingress controller (NGINX, Application Gateway Ingress Controller, or another option), managing Persistent Volume Claims for stateful workloads, and wiring up monitoring with Azure Monitor or Prometheus.

    None of this is particularly hard if you have a dedicated platform or DevOps team. But for a team of five developers shipping a SaaS product, this is real overhead that competes with feature work. A misconfigured cluster autoscaler during a traffic spike does not just cause degraded performance — it can cascade into an outage.

    Azure Container Apps removes this entire layer. There are no nodes to patch, no ingress controllers to configure, no cluster autoscaler to tune. You push a container image, configure environment variables and scale rules, and the platform handles the rest. For teams without dedicated infrastructure engineers, this is a significant productivity multiplier.

    Scaling Behavior: When ACA's Serverless Model Shines

    Azure Container Apps was built from the ground up around event-driven autoscaling via KEDA. Out of the box, ACA can scale your containers based on HTTP traffic, CPU, memory, Azure Service Bus queue depth, Azure Event Hub consumer lag, or any custom metric KEDA supports. More importantly, it can scale all the way to zero replicas when there is nothing to process — and you pay nothing while scaled to zero.

    This makes ACA an excellent fit for workloads with bursty or unpredictable traffic patterns: background job processors, webhook handlers, batch pipelines, internal APIs that see low-to-moderate traffic. If your workload sits idle for hours at a time, the cost savings from zero-scale can be substantial.

    AKS supports horizontal pod autoscaling and KEDA as an add-on, but scaling to zero requires additional configuration, and you still pay for the underlying nodes even if no pods are scheduled on them (unless you are also using Virtual Nodes or node pool autoscaling all the way down to zero, which adds more complexity). For baseline-heavy workloads that always run, AKS's fixed node cost is predictable and can be cheaper than per-request ACA billing at high sustained loads.

    Networking and Ingress: AKS Wins on Flexibility

    If your architecture involves complex networking requirements — internal load balancers, custom ingress routing rules, mutual TLS between services, integration with existing Azure Application Gateway or Azure Front Door configurations, or network policies enforced at the pod level — AKS gives you the surface area to configure all of it precisely.

    Azure Container Apps provides built-in ingress with HTTPS termination, traffic splitting for blue/green and canary deployments, and Dapr integration for service-to-service communication. For many teams, that is more than enough. But if you need to bolt Container Apps into an existing hub-and-spoke network topology with specific NSG rules and UDRs, you will find the abstraction starts to fight you. ACA supports VNet integration, but the configuration surface is much smaller than what AKS exposes.

    Multi-Container Architectures and Microservices

    Both platforms support multi-container deployments, but they model them differently. AKS uses Kubernetes Pods, which can contain multiple containers sharing a network namespace and storage volumes. This is the standard pattern for sidecar containers — log shippers, service mesh proxies, init containers for secret injection.

    Azure Container Apps supports multi-container configurations within an environment, and it has first-class support for Dapr as a sidecar abstraction. If you are building microservices that need service discovery, distributed tracing, and pub/sub messaging without wiring it all up manually, Dapr on ACA is genuinely elegant. The trade-off is that you are adopting Dapr's abstraction model, which may or may not align with how your team already thinks about inter-service communication.

    For teams building a large microservices estate with diverse inter-service communication requirements, AKS with a service mesh like Istio or Linkerd still offers the most control. For teams building five to fifteen services that need to talk to each other, ACA with Dapr is often simpler to operate at any given point in the lifecycle.

    Cost Considerations

    Cost is one of the most common decision drivers, and neither platform is universally cheaper. The comparison depends heavily on your workload profile:

    • Low or bursty traffic: ACA's scale-to-zero capability means you pay only for active compute. An API that handles 50 requests per hour costs nearly nothing on ACA. The same workload on AKS requires at least one running node regardless of traffic.
    • High, sustained throughput: AKS with right-sized reserved instances or spot node pools can be significantly cheaper than ACA per-vCPU-hour at high sustained load. ACA's consumption pricing adds up when you are running hundreds of thousands of requests continuously.
    • Operational cost: Do not forget the engineering time needed to manage AKS. Even at a conservative estimate of a few hours per week per cluster, that is a real cost that does not show up in the Azure bill.

    When to Choose AKS

    AKS is the right choice when your requirements push beyond what a managed platform can abstract cleanly. Choose AKS when you have a dedicated platform or DevOps team that can own the cluster, when you need custom Kubernetes operators or CRDs that do not exist as managed services, when your workload has complex stateful requirements with specific storage class needs, when you need precise control over networking at the pod and node level, or when you are running multiple teams with very different workloads that benefit from a shared cluster with namespace isolation and RBAC at scale.

    AKS is also the better choice if your organization has existing Kubernetes expertise and well-established GitOps workflows using tools like Flux or ArgoCD. The investment in that expertise has a higher return on a full Kubernetes environment than on a platform that abstracts it away.

    When to Choose Azure Container Apps

    Azure Container Apps wins when developer productivity and operational simplicity are the primary constraints. Choose ACA when your team does not have or does not want to staff dedicated Kubernetes expertise, when your workloads are event-driven or have variable traffic patterns that benefit from scale-to-zero, when you want built-in Dapr support for microservice communication without managing a service mesh, when you need fast time-to-production without cluster provisioning and configuration overhead, or when you are running internal tooling, staging environments, or background processors where operational complexity would be disproportionate to the workload value.

    ACA has also matured significantly since its initial release. Dedicated plan pricing, GPU support, and improved VNet integration have addressed many of the early limitations that pushed teams toward AKS by default. It is worth re-evaluating ACA even if you dismissed it a year or two ago.

    The Decision in One Question

    If you could only ask one question to guide this decision, ask this: Does your team want to operate a container platform, or use one?

    AKS is for teams that want — or need — to operate a platform. ACA is for teams that want to use one. Both are excellent tools. Neither is the wrong answer in the right context. The mistake is defaulting to one without honestly evaluating what your specific team, workload, and organizational constraints actually need.

  • Reasoning Models vs. Standard LLMs: When the Expensive Thinking Is Actually Worth It

    Reasoning Models vs. Standard LLMs: When the Expensive Thinking Is Actually Worth It

    The AI landscape has split into two lanes. In one lane: standard large language models (LLMs) that respond quickly, cost a fraction of a cent per call, and handle the vast majority of text tasks without breaking a sweat. In the other: reasoning models such as OpenAI o3, Anthropic Claude with extended thinking, and Google Gemini with Deep Research, that slow down deliberately, chain their way through intermediate steps, and charge multiples more for the privilege.

    Choosing between them is not just a technical question. It is a cost-benefit decision that depends heavily on what you are asking the model to do.

    What Reasoning Models Actually Do Differently

    A standard LLM generates tokens in a single forward pass through its neural network. Given a prompt, it predicts the most probable next word, then the one after that, all the way to a completed response. It does not backtrack. It does not re-evaluate. It is fast because it is essentially doing one shot at the answer.

    Reasoning models break this pattern. Before producing a final response, they allocate compute to an internal scratchpad, sometimes called a thinking phase, where they work through sub-problems, consider alternatives, and catch contradictions. OpenAI describes o3 as spending additional compute at inference time to solve complex tasks. Anthropic frames extended thinking as giving Claude space to reason through hard problems step by step before committing to an answer.

    The result is measurably better performance on tasks that require multi-step logic, but at a real cost in both time and money. O3-mini is roughly 10 to 20 times more expensive per output token than GPT-4o-mini. Extended thinking in Claude Sonnet is significantly pricier than standard mode. Those numbers matter at scale.

    Where Reasoning Models Shine

    The category where reasoning models justify their cost is problems with many interdependent constraints, where getting one step wrong cascades into a wrong answer and where checking your own work actually helps.

    Complex Code Generation and Debugging

    Writing a function that calls an API is well within a standard LLM capability. Designing a correct, edge-case-aware implementation of a distributed locking algorithm, or debugging why a multi-threaded system deadlocks under a specific race condition, is a different matter. Reasoning models are measurably better at catching their own logic errors before they show up in the output. In benchmark evaluations like SWE-bench, o3-level models outperform standard models by wide margins on difficult software engineering tasks.

    Math and Quantitative Analysis

    Standard LLMs are notoriously inconsistent at arithmetic and symbolic reasoning. They will get a simple percentage calculation wrong, or fumble unit conversions mid-problem. Reasoning models dramatically close this gap. If your pipeline involves financial modeling, data analysis requiring multi-step derivations, or scientific computations, the accuracy gain often makes the cost irrelevant compared to the cost of a wrong answer.

    Long-Horizon Planning and Strategy

    Tasks like designing a migration plan for moving Kubernetes workloads from on-premises to Azure AKS require holding many variables in mind simultaneously, making tradeoffs, and maintaining consistency across a long output. Standard LLMs tend to lose coherence on these tasks, contradicting themselves between sections or missing constraints mentioned early in the prompt. Reasoning models are significantly better at planning tasks with high internal consistency requirements.

    Agentic Workflows Requiring Reliable Tool Use

    If you are building an agent that uses tools such as searching databases, running queries, calling APIs, and synthesizing results into a coherent action plan, a reasoning model’s ability to correctly sequence steps and handle unexpected intermediate results is a meaningful advantage. Agentic reliability is one of the biggest selling points for o3-level models in enterprise settings.

    Where Standard LLMs Are the Right Call

    Reasoning models win on hard problems, but most real-world AI workloads are not hard problems. They are repetitive, well-defined, and tolerant of minor imprecision. In these cases, a fast, inexpensive standard model is the right architectural choice.

    Content Generation at Scale

    Writing product descriptions, generating email drafts, summarizing documents, translating text: these tasks are well within standard LLM capability. Running them through a reasoning model adds cost and latency without any meaningful quality improvement. GPT-4o or Claude Haiku handle these reliably.

    Retrieval-Augmented Generation Pipelines

    In most RAG setups, the hard work is retrieval: finding the right documents and constructing the right context. The generation step is typically straightforward. A standard model with well-constructed context will answer accurately. Reasoning overhead here adds latency without a real benefit.

    Classification, Extraction, and Structured Output

    Sentiment classification, named entity extraction, JSON generation from free text, intent detection: these are classification tasks dressed up as generation tasks. Standard models with a good system prompt and schema validation handle them reliably and cheaply. Reasoning models will not improve accuracy here; they will just slow things down.

    High-Throughput, Latency-Sensitive Applications

    If your product requires real-time response such as chat interfaces, live code completions, or interactive voice agents, the added thinking time of a reasoning model becomes a user experience problem. Standard models under two seconds are expected by users. Reasoning models can take 10 to 60 seconds on complex problems. That trade is only acceptable when the task genuinely requires it.

    A Practical Decision Framework

    A useful mental model: ask whether the task has a verifiable correct answer with intermediate dependencies. If yes, such as debugging a specific bug, solving a constraint-heavy optimization problem, or generating a multi-component architecture with correct cross-references, a reasoning model earns its cost. If no, use the fastest and cheapest model that meets your quality bar.

    Many teams route by task type. A lightweight classifier or simple rule-based router sends complex analytical and coding tasks to the reasoning tier, while standard generation, summarization, and extraction go to the cheaper tier. This hybrid architecture keeps costs reasonable while unlocking reasoning-model quality where it actually matters.

    Watch the Benchmarks With Appropriate Skepticism

    Benchmark comparisons between reasoning and standard models can be misleading. Reasoning models are specifically optimized for the kinds of problems that appear in benchmarks: math competitions, coding challenges, logic puzzles. Real-world tasks often do not look like benchmark problems. A model that scores ten points higher on GPQA might not produce noticeably better customer support responses or marketing copy.

    Before committing to a reasoning model for your use case, run your own evaluations on representative tasks from your actual workload. The benchmark spread between model tiers often narrows considerably when you move from synthetic test cases to production-representative data.

    The Cost Gap Is Narrowing But Not Gone

    Model pricing trends consistently downward, and reasoning model costs are falling alongside the rest of the market. OpenAI o4-mini is substantially cheaper than o3 while preserving most of the reasoning advantage. Anthropic Claude Haiku with thinking is affordable for many use cases where the full Sonnet extended thinking budget is too expensive. The gap between standard and reasoning tiers is narrower than it was in 2024.

    But it is not zero, and at high call volumes the difference remains significant. A workload running 10 million calls per month at a 15x cost differential between tiers is a hard budget conversation. Plan for it before you are surprised by it.

    The Bottom Line

    Reasoning models are genuinely better at genuinely hard tasks. They are not better at everything: they are better at tasks where thinking before answering actually helps. The discipline is identifying which tasks those are and routing accordingly. Use reasoning models for complex code, multi-step analysis, hard math, and reliability-critical agentic workflows. Use standard models for everything else. Neither tier should be your default for all workloads. The right answer is almost always a deliberate choice based on what the task actually requires.

  • How to Build a Lightweight AI API Cost Monitor Before Your Monthly Bill Becomes a Fire Drill

    How to Build a Lightweight AI API Cost Monitor Before Your Monthly Bill Becomes a Fire Drill

    Every team that integrates with OpenAI, Anthropic, Google, or any other inference API hits the same surprise: the bill at the end of the month is three times what anyone expected. Token-based pricing is straightforward in theory, but in practice nobody tracks spend until something hurts. A lightweight monitoring layer, built before costs spiral, saves both budget and credibility.

    Why Standard Cloud Cost Tools Miss AI API Spend

    Cloud cost management platforms like AWS Cost Explorer or Azure Cost Management are built around resource-based billing: compute hours, storage gigabytes, network egress. AI API calls work differently. You pay per token, per image, or per minute of audio processed. Those charges show up as a single line item on your cloud bill or as a separate invoice from the API provider, with no breakdown by feature, team, or environment.

    This means the standard cloud dashboard tells you how much you spent on AI inference in total, but not which endpoint, prompt pattern, or user cohort drove the cost. Without that granularity, you cannot make informed decisions about where to optimize. You just know the number went up.

    The Minimum Viable Cost Monitor

    You do not need a commercial observability platform to get started. A useful cost monitor can be built with three components that most teams already have access to: a proxy or middleware layer, a time-series store, and a simple dashboard.

    Step 1: Intercept and Tag Every Request

    The foundation is a thin proxy that sits between your application code and the AI provider. This can be a reverse proxy like NGINX, a sidecar container, or even a wrapper function in your application code. The proxy does two things: it logs the token count from each response, and it attaches metadata tags (team, feature, environment, model name) to the log entry.

    Most AI providers return token usage in the response body. OpenAI includes a usage object with prompt_tokens and completion_tokens. Anthropic returns similar fields. Your proxy reads these values after each call and writes a structured log line. If you are using a library like LiteLLM or Helicone, this interception layer is already built in. The key is to make sure every request flows through it, with no exceptions for quick scripts or test environments.

    Step 2: Store Usage in a Time-Series Format

    Raw log lines are useful for debugging but terrible for cost analysis. Push the tagged usage data into a time-series store. InfluxDB, Prometheus, or even a simple SQLite database with timestamp-indexed rows will work. The schema should include at minimum: timestamp, model name, token count (prompt and completion separately), estimated cost, and your metadata tags.

    Estimated cost is calculated by multiplying token counts by the per-token rate for the model used. Keep a configuration table that maps model names to their current pricing. AI providers change pricing regularly, so this table should be easy to update without redeploying anything.

    Step 3: Visualize and Alert

    Connect your time-series store to a dashboard. Grafana is the obvious choice if you are already running Prometheus or InfluxDB, but a simple web page that queries your database and renders charts works fine for smaller teams. The dashboard should show daily spend by model, spend by tag (team or feature), and a trailing seven-day trend line.

    More importantly, set up alerts. A threshold alert that fires when daily spend exceeds a configurable limit catches runaway scripts and unexpected traffic spikes. A rate-of-change alert catches gradual cost creep, such as when a new feature quietly doubles your token consumption over a week. Both types should notify a channel that someone actually reads, not a mailbox that gets ignored.

    Tag Discipline Makes or Breaks the Whole System

    The monitor is only as useful as its tags. If every request goes through with a generic tag like “production,” you have a slightly fancier version of the total spend number you already had. Enforce tagging at the proxy layer: if a request arrives without the required metadata, reject it or tag it as “untagged” and alert on that category separately.

    Good tagging dimensions include the calling service or feature name, the environment (dev, staging, production), the team or cost center responsible, and whether the request is user-facing or background processing. With those four dimensions, you can answer questions like “How much does the summarization feature cost per day in production?” or “Which team’s dev environment is burning tokens on experiments?”

    Handling Multiple Providers and Models

    Most teams use more than one model, and some use multiple providers. Your cost monitor needs to normalize across all of them. A request to GPT-4o and a request to Claude Sonnet have different per-token costs, different token counting methods, and different response formats. The proxy layer should handle these differences so the data store sees a consistent schema regardless of provider.

    This also means your pricing configuration table must cover every model you use. When someone experiments with a new model in a development environment, the cost monitor should still capture and price those requests correctly. A missing pricing entry should trigger a warning, not a silent zero-cost row that hides real spend.

    What to Do When the Dashboard Shows a Problem

    Visibility without action is just expensive awareness. Once your monitor surfaces a cost spike, you need a playbook. Common fixes include switching to a smaller or cheaper model for non-critical tasks, caching repeated prompts so identical questions do not hit the API every time, batching requests where the API supports it, and trimming prompt length by removing unnecessary context or system instructions.

    Each of these optimizations has trade-offs. A smaller model may produce lower-quality output. Caching adds complexity and can serve stale results. Batching requires code changes. Prompt trimming risks losing important context. The cost monitor gives you the data to evaluate these trade-offs quantitatively instead of guessing.

    Start Before You Need It

    The best time to build a cost monitor is before your AI spend is large enough to worry about. When usage is low, the monitor is cheap to run and easy to validate. When usage grows, you already have the tooling in place to understand where the money goes. Teams that wait until the bill is painful are stuck building monitoring infrastructure under pressure, with no historical baseline to compare against.

    A lightweight proxy, a time-series store, a simple dashboard, and a few alerts. That is all it takes to avoid the monthly surprise. The hard part is not the technology. It is the discipline to tag every request and keep the pricing table current. Get those two habits right and the rest follows.

  • How to Separate Dev, Test, and Prod Models in Azure AI Without Tripling Your Governance Overhead

    How to Separate Dev, Test, and Prod Models in Azure AI Without Tripling Your Governance Overhead

    Most enterprise teams understand the need to separate development, test, and production environments for ordinary software. The confusion starts when AI enters the stack. Some teams treat models, prompts, connectors, and evaluation data as if they can float across environments with only light labeling. That usually works until a prototype prompt leaks into production, a test connector touches live content, or a platform team realizes that its audit trail cannot clearly explain which behavior belonged to which stage.

    Environment separation for AI is not only about keeping systems neat. It is about preserving trust in how model-backed behavior is built, reviewed, and released. The goal is not to create three times as much bureaucracy. The goal is to keep experimentation flexible while making production behavior boring in the best possible way.

    Separate More Than the Endpoint

    A common mistake is to say an AI platform has proper environment separation because development uses one deployment name and production uses another. That is a start, but it is not enough. Strong separation usually includes the model deployment, prompt configuration, tool permissions, retrieval sources, secrets, logging destinations, and approval path. If only the endpoint changes while everything else stays shared, the system still has plenty of room for cross-environment confusion.

    This matters because AI behavior is assembled from several moving parts. The model is only one layer. A team may keep production on a stable deployment while still allowing a development prompt template, a loose retrieval connector, or a broad service principal to shape what happens in practice. Clean boundaries come from the full path, not from one variable in an app settings file.

    Let Development Move Fast, but Keep Production Boring

    Development environments should support quick prompt iteration, evaluation experiments, and integration changes. That freedom is useful because AI systems often need more tuning cycles than conventional application features. The problem appears when teams quietly import that experimentation style into production. A platform becomes harder to govern when the live environment is treated like an always-open workshop.

    The healthier pattern is to make development intentionally flexible and production intentionally predictable. Developers can explore different prompt structures, tool choices, and ranking logic in lower environments, but the release path into production should narrow sharply. A production change should look like a reviewed release, not a late-night tweak that happened to improve a metric.

    Use Test Environments to Validate Operational Behavior, Not Just Output Quality

    Many teams use test environments only to see whether the answer looks right. That is too small a role for a critical stage. Test should also validate the operational behavior around the model: access control, logging, rate limits, fallback behavior, content filtering, connector scope, and cost visibility. If those controls are not exercised before production, the organization is not really testing the system it plans to operate.

    That operational focus is especially important when several internal teams share the same AI platform. A production incident rarely begins with one wrong sentence on a screen. It usually begins with a control that behaved differently than expected under real load or with real data. Test environments exist to catch those mismatches while the blast radius is still small.

    Keep Identity and Secret Boundaries Aligned to the Environment

    Environment separation breaks down quickly when identities are shared. If development, test, and production all rely on the same broad credential or connector identity, the labels may differ while the risk stays the same. Separate managed identities, narrower role assignments, and environment-specific secret scopes make it much easier to understand what each stage can actually touch.

    This is one of those areas where small shortcuts create large future confusion. Shared identities make early setup easier, but they also blur ownership during incident response and audit review. When a risky retrieval or tool call appears in logs, teams should be able to tell immediately which environment made it and what permissions it was supposed to have.

    Treat Prompt and Retrieval Changes Like Release Artifacts

    AI teams sometimes version code carefully while leaving prompts and retrieval settings in a loose operational gray zone. That gap is dangerous because those assets often shape behavior more directly than the surrounding application code. Prompt templates, grounding strategies, ranking weights, and safety instructions should move through environments with the same basic discipline as application releases.

    That does not require heavyweight ceremony. It does require traceability. Teams should know which prompt set is active in each environment, what changed between versions, and who approved the production promotion. The point is not to slow learning. The point is to prevent a platform from becoming impossible to explain after six months of rapid iteration.

    Avoid Multiplying Governance by Standardizing the Control Pattern

    Some leaders resist stronger separation because they assume it means three independent stacks of policy and paperwork. That is the wrong design target. Good platform teams standardize the control pattern across environments while changing the risk posture at each stage. The same policy families can exist everywhere, but production should have tighter defaults, narrower permissions, stronger approvals, and more durable logging.

    That approach reduces overhead because engineers learn one operating model instead of three unrelated ones. It also improves governance quality. Reviewers can compare development, test, and production using the same conceptual map: identity, connector scope, prompt version, model deployment, approval gate, telemetry, and rollback path.

    Define Promotion Rules Before the First High-Pressure Launch

    The worst time to invent environment rules is during a rushed release. Promotion criteria should exist before the platform becomes politically important. A practical checklist might require evaluation results above a defined threshold, explicit review of tool permissions, confirmation of logging coverage, connector scope verification, and a documented rollback plan. Those are not glamorous tasks, but they prevent fragile launches.

    Production AI should feel intentionally promoted, not accidentally arrived at. If a team cannot explain why a model behavior is ready for production, it probably is not. The discipline may look fussy during calm weeks, but it becomes invaluable during audits, incidents, and leadership questions about how the system is actually controlled.

    Final Takeaway

    Separating dev, test, and prod in Azure AI is not about pretending AI needs a totally new operating philosophy. It is about applying familiar environment discipline to a stack that includes models, prompts, connectors, identities, and evaluation flows. Teams that separate those elements cleanly usually move faster over time because production becomes easier to trust and easier to debug.

    Teams that skip the discipline often discover the same lesson the hard way: a shared AI platform becomes expensive and politically fragile when nobody can prove which environment owned which behavior. Strong separation keeps experimentation useful and governance manageable at the same time.

  • Why Internal AI Automations Need a Kill Switch Before Wider Rollout

    Why Internal AI Automations Need a Kill Switch Before Wider Rollout

    Teams love to talk about what an internal AI automation can do when it works. They spend much less time deciding how to stop it when it behaves badly. That imbalance is risky. The more an assistant can read, generate, route, or trigger on behalf of a team, the more important it becomes to have an emergency brake that is obvious, tested, and fast.

    A kill switch is not a dramatic movie prop. It is a practical operating control. It gives humans a clean way to pause automation before a noisy model response becomes a customer issue, a compliance event, or a chain of bad downstream updates. If an organization is ready to let AI touch real workflows, it should be ready to stop those workflows just as quickly.

    What a Kill Switch Actually Means

    In enterprise AI, a kill switch is any control that can rapidly disable a model-backed action path without requiring a long deployment cycle. That may be a feature flag, a gateway policy, a queue pause, a connector disablement, or a role-based control that removes write access from an agent. The exact implementation matters less than the outcome: the risky behavior stops now, not after a meeting tomorrow.

    The strongest designs use more than one level. A product team might have an application-level toggle for a single feature, while the platform team keeps a broader control that can block an entire integration or tenant-wide route. That layering matters because some failures are local and some are systemic.

    Why Prompt Quality Is Not Enough Protection

    Many AI programs still overestimate how much safety can be achieved through careful prompting alone. Good prompts help, but they do not eliminate model drift, bad retrieval, broken tool permissions, malformed outputs, or upstream data problems. When the failure mode moves from “odd text on a screen” to “the system changed something important,” operational controls matter more than prompt polish.

    This is especially true for internal agents that can create tickets, update records, summarize regulated content, or trigger secondary automations. In those systems, a single bad assumption can spread faster than a reviewer can read logs. The point of a kill switch is to bound blast radius before forensics become a scavenger hunt.

    Place the Emergency Stop at the Control Plane, Not Only in the App

    If the only way to disable a risky AI workflow is to redeploy the product, the control is too slow. Better teams place stop controls in the parts of the system that sit upstream of the model and downstream actions. API gateways, orchestration services, feature management systems, message brokers, and policy engines are all good places to anchor a pause capability.

    Control-plane stops are useful because they can interrupt behavior even when the application itself is under stress. They also create cleaner separation of duties. A security or platform engineer should not need to edit business logic in a hurry just to stop an unsafe route. They should be able to block the path with a governed operational control.

    • Block all write actions while still allowing read-only diagnostics.
    • Disable a single connector without taking down the full assistant experience.
    • Route traffic to a safe fallback model or static response.
    • Pause queue consumers so harmful outputs do not fan out to downstream systems.

    Those options give incident responders room to stabilize the situation without erasing evidence or turning off every helpful capability at once.

    Define Clear Triggers Before You Need Them

    A kill switch fails when nobody agrees on when to use it. Strong teams define activation thresholds ahead of time. That may include repeated hallucinated policy guidance, unusually high tool-call error rates, suspicious data egress patterns, broken moderation outcomes, or unexplained spikes in automated changes. The threshold does not have to be perfect, but it has to be concrete enough that responders are not arguing while the system keeps running.

    It also helps to separate temporary caution from full shutdown. For example, a team may first drop the assistant into read-only mode, then disable external connectors, then fully block inference if the problem persists. Graduated response levels are calmer and usually more sustainable than a single giant on-off decision.

    Make Ownership Obvious

    One of the most common enterprise failure patterns is shared ownership with no real operator. The application team assumes the platform team can stop the workflow. The platform team assumes the product owner will make the call. Security notices the problem but is not sure which switch is safe to touch. That is how minor issues become long incidents.

    Every important AI automation should answer four operational questions in plain language: who can pause it, who approves a restart, where the control lives, and what evidence must be checked before turning it back on. If those answers are hidden in tribal knowledge, the design is unfinished.

    Test the Stop Path Like a Real Feature

    Organizations routinely test model quality, latency, and cost. They should test emergency shutdowns with the same seriousness. A kill switch that exists only on an architecture slide is not a control. Run drills. Confirm that the right people can access it, that logs still capture the event, that fallback behavior is understandable, and that the pause does not silently leave a dangerous side channel open.

    These drills do not need to be theatrical. A practical quarterly exercise is enough for many teams: simulate a bad retrieval source, a runaway connector, or a model policy regression, then measure how long it takes to pause the workflow and communicate status. The exercise usually reveals at least one hidden dependency worth fixing.

    Use Restarts as a Deliberate Decision, Not a Reflex

    Turning an AI automation back on should be a controlled release, not an emotional relief valve. Before re-enabling, teams should verify the triggering condition, validate the fix, review logs for collateral effects, and confirm that the same issue will not instantly recur. If the automation writes into business systems, a second set of eyes is often worth the extra few minutes.

    That discipline protects credibility. Teams lose trust in internal AI faster when the system fails, gets paused, then comes back with the same problem an hour later. A deliberate restart process tells the organization that automation is being operated like infrastructure, not treated like a toy with admin access.

    Final Takeaway

    The most mature AI teams do not just ask whether a workflow can be automated. They ask how quickly they can contain it when reality gets messy. A kill switch is not proof that a program lacks confidence. It is proof that the team understands systems fail in inconvenient ways and plans accordingly.

    If an internal AI automation is important enough to connect to real data and real actions, it is important enough to deserve a fast, tested, well-owned way to stop. Wider rollout should come after that control exists, not before.